
Executive Summary
Symbiotic Automation Systems (SAS), a 25+ year industrial automation leader and Siemens-authorized system integrator , identified a critical gap: its manufacturing clients collected rich process data but had no real-time analytics tools. Previously, operators exported batch data to spreadsheets for manual analysis, making it slow to spot trends, compare lots, or detect anomalies . To solve this, OpenTurf delivered a custom desktop application that connects directly to Symbiotic’s production database . The new platform automates batch analysis – letting engineers define logical parameter groups and instantly visualize results. Key features include interactive time-series charts and color-coded deviation bars, plus automated PDF/Excel/CSV reporting. The result is dramatically faster insight: for example, anomaly detection is ~60% faster and report generation now happens in minutes instead of hours. Together, these improvements boost product quality oversight and process efficiency.
About the Client
Founded in 1999, Symbiotic Automation Systems Pvt. Ltd. is a Bangalore-based industrial automation integrator . It serves medium-to-large manufacturers, OEMs and processing plants with end-to-end automation solutions . Symbiotic is an Authorized System House of Siemens for its full automation and drives portfolio , and through partnerships with other global vendors like RedLion (USA) has deep expertise in control systems, SCADA, PLCs, drives and motion control. The company offers “concept-to-commissioning” services – from custom control panel design to Industry 4.0 digitalization – helping clients optimize performance and future-proof their operations .
The Challenge
Before OpenTurf’s involvement, Symbiotic’s production customers faced several analytics roadblocks:
- No real-time visualization: Critical production parameters were trapped in databases with no dashboard. Engineers had no easy way to track trends or compare recent batches.
- Manual data handling: Teams exported data to Excel for analysis. This labor-intensive process was slow, error-prone, and hindered quick decision-making .
- Unstructured parameter grouping: All measurements were treated in isolation. There was no way to group related parameters by process phase (e.g. heating vs. cooling), making phase-wise analysis cumbersome .
- Difficulty spotting anomalies: Without graphical analysis, outliers and deviations often went unnoticed. Engineers could not easily identify which batch parameters had drifted outside acceptable ranges .
- Cumbersome reporting: Reporting was generic and manual, lacking customization for specific parameters or batch comparisons. Valuable insights were buried in spreadsheets.
These gaps left Symbiotic’s clients unable to leverage their rich process data for proactive quality control and efficiency improvements.
The Solution
OpenTurf designed and built a custom desktop application to fill these gaps. The solution connects directly to Symbiotic’s existing production database (e.g. MS SQL, MySQL, PostgreSQL), running read-only queries to pull live batch data. Users can quickly create parameter groups (or “pen lists”) tied to production phases (heating, cooling, etc.), then apply them to any batch. The application automatically generates interactive visualizations – including multi-line trend charts and deviation-highlighted bar charts – that clearly reveal parameter behavior and out-of-spec values . Operators can select one or more batches and see side-by-side comparisons, enabling rapid root-cause analysis of any discrepancies. Finally, the tool automates report generation: users can export batch or comparison summaries (with charts and tables) to PDF, Excel or CSV with a single click . Together, these capabilities replace manual spreadsheet work with instant insight, empowering Symbiotic’s team to detect issues early and make data-driven decisions.

Key Features and Innovations
- Visualization: The app provides rich data graphics out of the box. Time-series line graphs plot one or more parameters per batch to spot trends, while deviation bar charts highlight differences against a benchmark or “master” batch . Visual cues (color-coding beyond threshold limits) make outliers and drifts obvious at a glance. Users can zoom, pan and hover to inspect details, and can toggle linear/logarithmic scales or change axis types (integer, real, log) for clarity.
- Database Integration: Users simply configure a database connection (SQL Server, MySQL, Access, etc.) – no data migration is needed. A custom query builder lets admins specify exactly which tables/columns to use, ensuring fast live data retrieval . Once set up, all authorized users access the same real-time data without extra duplication. This tight integration supports continuous “live” monitoring and feedback.
- Custom Reporting: Reports are fully customizable. Users can select specific parameters or groups, choose which graphs and tables to include, and add annotations. The app then exports clean, branded reports to PDF, Excel or CSV . Batch Reports focus on one batch’s data, while Comparison Reports show multi-batch analysis. Administrators can schedule automated report generation and distribution (emailing PDF summaries, for example) to stakeholders.
- Role-Based Access Control (RBAC): The system supports Admin and User roles to protect data and features . Admins have full privileges: they set up database connections, create/delete users, define parameter groups (public or private), and assign master batches. Regular users (operators/engineers) can view and analyze data using only the groups and reports shared with them . This ensures data integrity and that each user sees only relevant information.
- Batch Comparison: Engineers can select multiple batches to compare side-by-side on the same graphs. For example, one batch’s temperature profile during the heating phase can be overlaid against another’s . Such comparisons quickly reveal root causes: e.g. a successful batch vs. a failing one might show higher pressure spikes or longer phase durations in one run. Split-view charts and overlays make these insights intuitive, speeding up troubleshooting.
Results and Business Impact
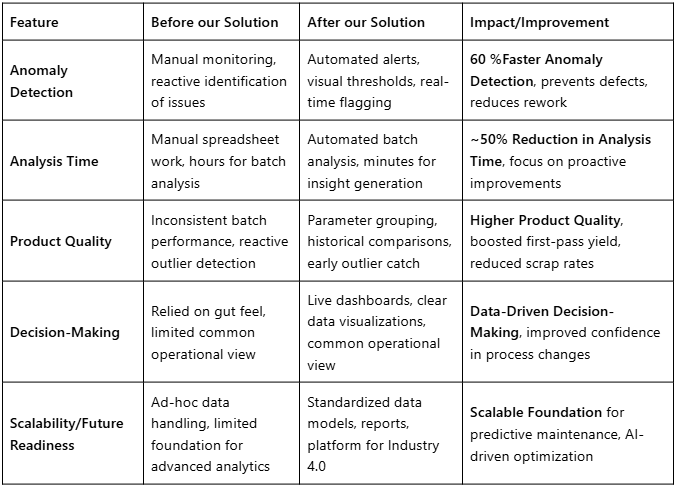
OpenTurf’s solution delivered both quantitative gains and qualitative improvements for Symbiotic and its customers. Key impacts include:
Testimonial
“OpenTurf’s custom data platform has redefined our production monitoring. We now have real-time visibility into every batch and automated alerts for any out-of-range parameters. This has dramatically accelerated our ability to detect issues and optimize our processes. The tool is intuitive for operators yet powerful enough for our engineers to dive deep into the data. OpenTurf has been a true technology partner in bridging our OT and IT systems.” – Shreyank Hebbar, Technology Architect, Symbiotic Automation Systems
OpenTurf’s partnership with Symbiotic Automation demonstrates our strength as a forward-looking IT/OT integration specialist for industry. By combining deep manufacturing domain knowledge with modern software design, we delivered a solution that transforms raw factory data into actionable intelligence. Symbiotic’s success story highlights how data visualization and automation can unlock efficiency and quality gains. If your organization is facing similar challenges – from siloed data to slow manual reporting – OpenTurf is ready to help. Contact us to learn how we can co-create a custom analytics platform to power your Industry 4.0 vision.
Contact OpenTurf Technologies to turn data into your competitive advantage.
Sources: Symbiotic and OpenTurf project documentation ; Symbiotic Automation Systems company information.